Analytics
Analytics Overview
The Analytics section gives you a complete, real-time performance breakdown of your campaign. It helps you understand how your leads interact with your emails—from opens and clicks to replies and overall engagement trends. With clear charts and step-level insights, you can quickly identify what's working and optimize your outreach strategy.
This section includes:
- Campaign Performance Summary
- Engagement Chart (Timeline Graph)
- Step Analytics
- Activity Logs (Email-by-Email Breakdown)
Below is a full guide to each part.
Campaign Performance Summary
When you open the Analytics tab, the first thing you'll see is the campaign's key metrics:
🔹 Total Leads
Shows the total number of leads currently enrolled in the campaign.
🔹 Open Rate
Shows the percentage of emails opened by leads.
Open Tracking must be enabled under Options → Open Tracking.
🔹 Click Rate
Shows how many leads clicked on a link inside your email.
Requires Link Tracking to be enabled under Options → Link Tracking.
🔹 Reply Rate
Shows what percentage of leads replied to your email sequence.
These metrics update automatically as your campaign sends emails and receives engagement.
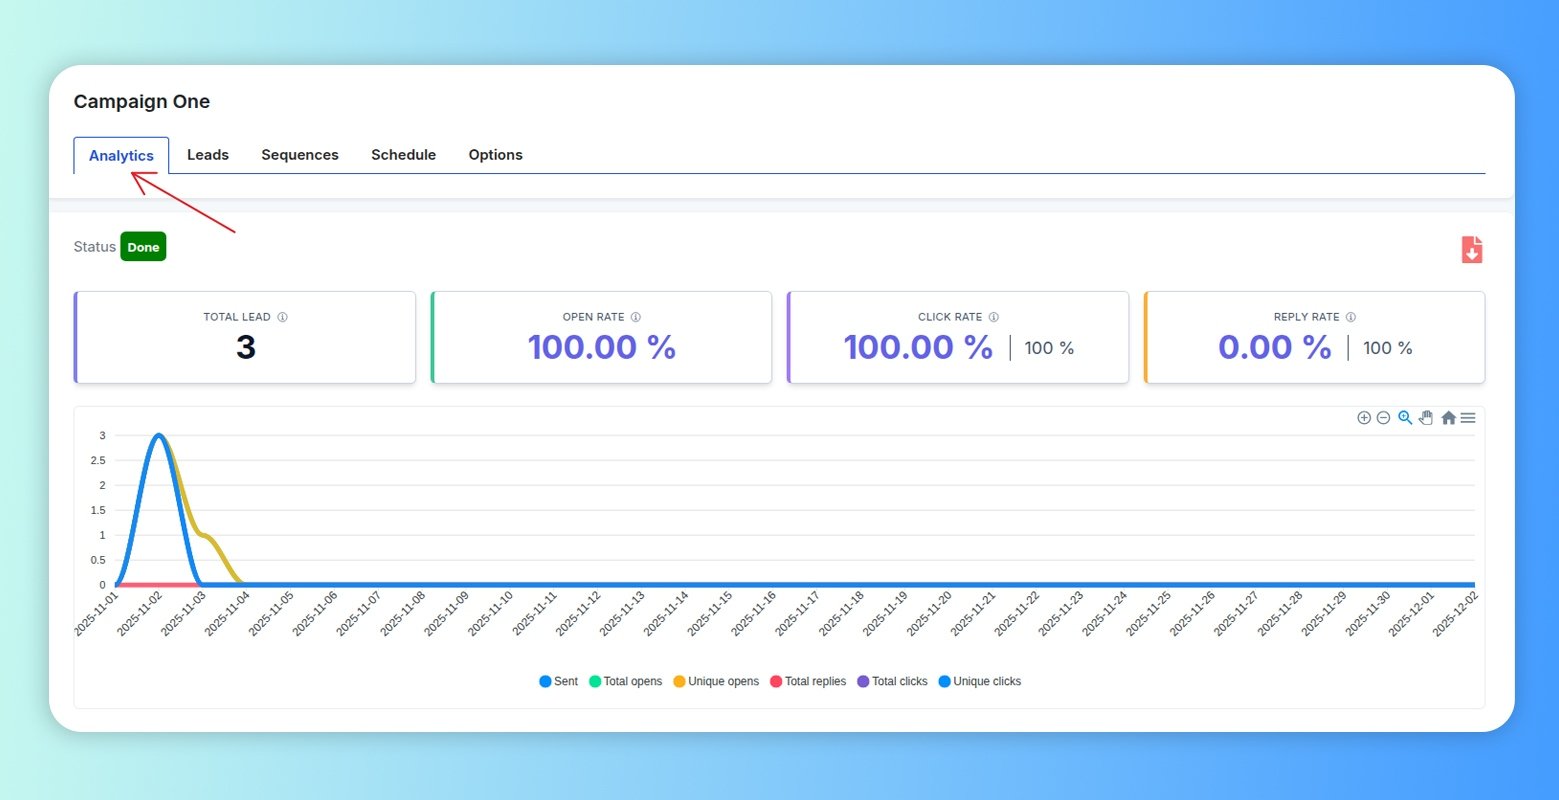
Engagement Timeline Chart
The engagement chart visually displays all important events over time:
- Sent emails
- Total opens
- Unique opens
- Total clicks
- Unique clicks
- Total replies
Each metric is plotted on the timeline so you can monitor performance trends and compare activity across days.
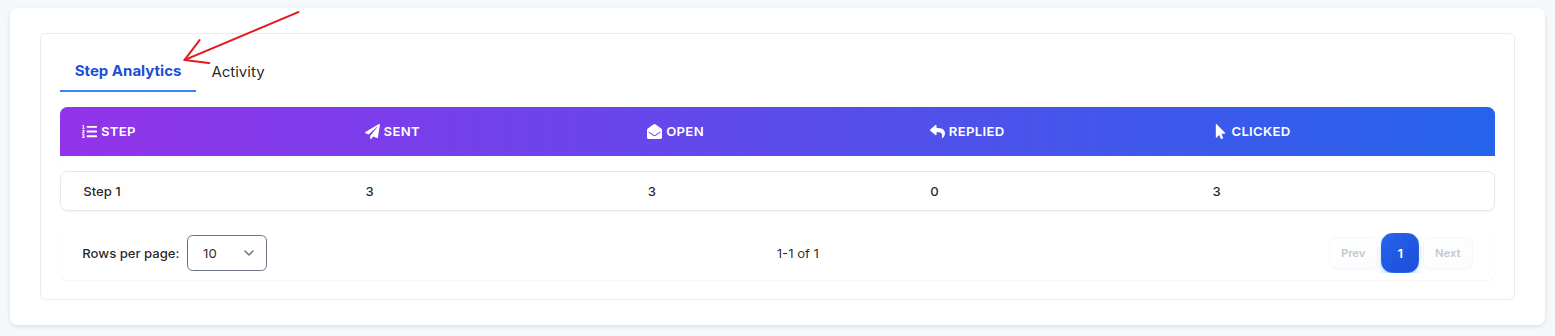
Step Analytics (Per-Step Performance)
The Step Analytics tab breaks performance down by each step of your sequence.
For each step you will see:
- Step Name
- Sent – Number of leads who reached this step and were emailed.
- Open – How many opened the email at this step.
- Replied – Number of replies from this step.
- Clicked – Number of link clicks inside the email.
This view helps you understand:
- Which steps produce the most engagement.
- Where drop-offs happen.
- Which follow-ups perform best.
- What type of messaging drives replies or clicks.
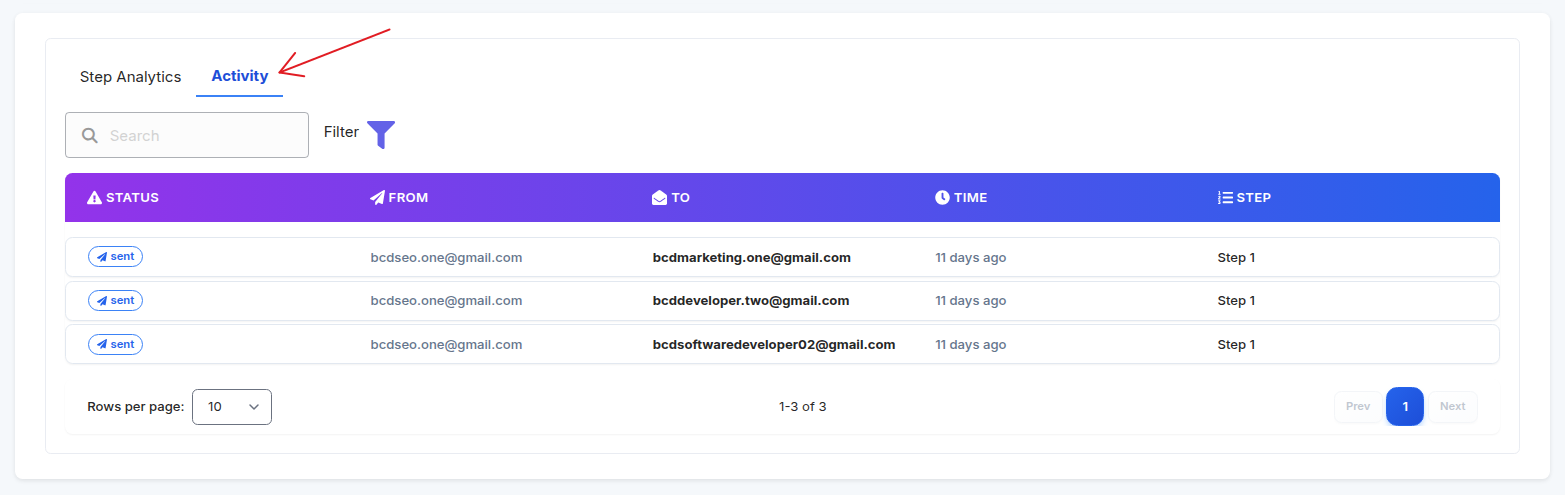
Activity Log (Email-By-Email Breakdown)
The Activity tab shows a detailed table of every email event, including:
- Status (Sent, Replied, Opened, Clicked)
- From (Sending account)
- To (Lead email)
- Time (Exact timestamp)
- Step (Which step triggered the email)
You can:
- Search by lead email
- Filter by status
- Check sending activity historically
- Validate when each lead received or interacted with your email
This section is essential for troubleshooting or verifying email delivery.
Summary
The Analytics section provides everything you need to monitor, measure, and optimize your cold email campaign performance:
- Real-time engagement metrics.
- Step-by-step performance breakdown.
- Detailed activity logs.
- Clean visual charts.
Use this data to refine subject lines, adjust follow-ups, and improve overall response rates.